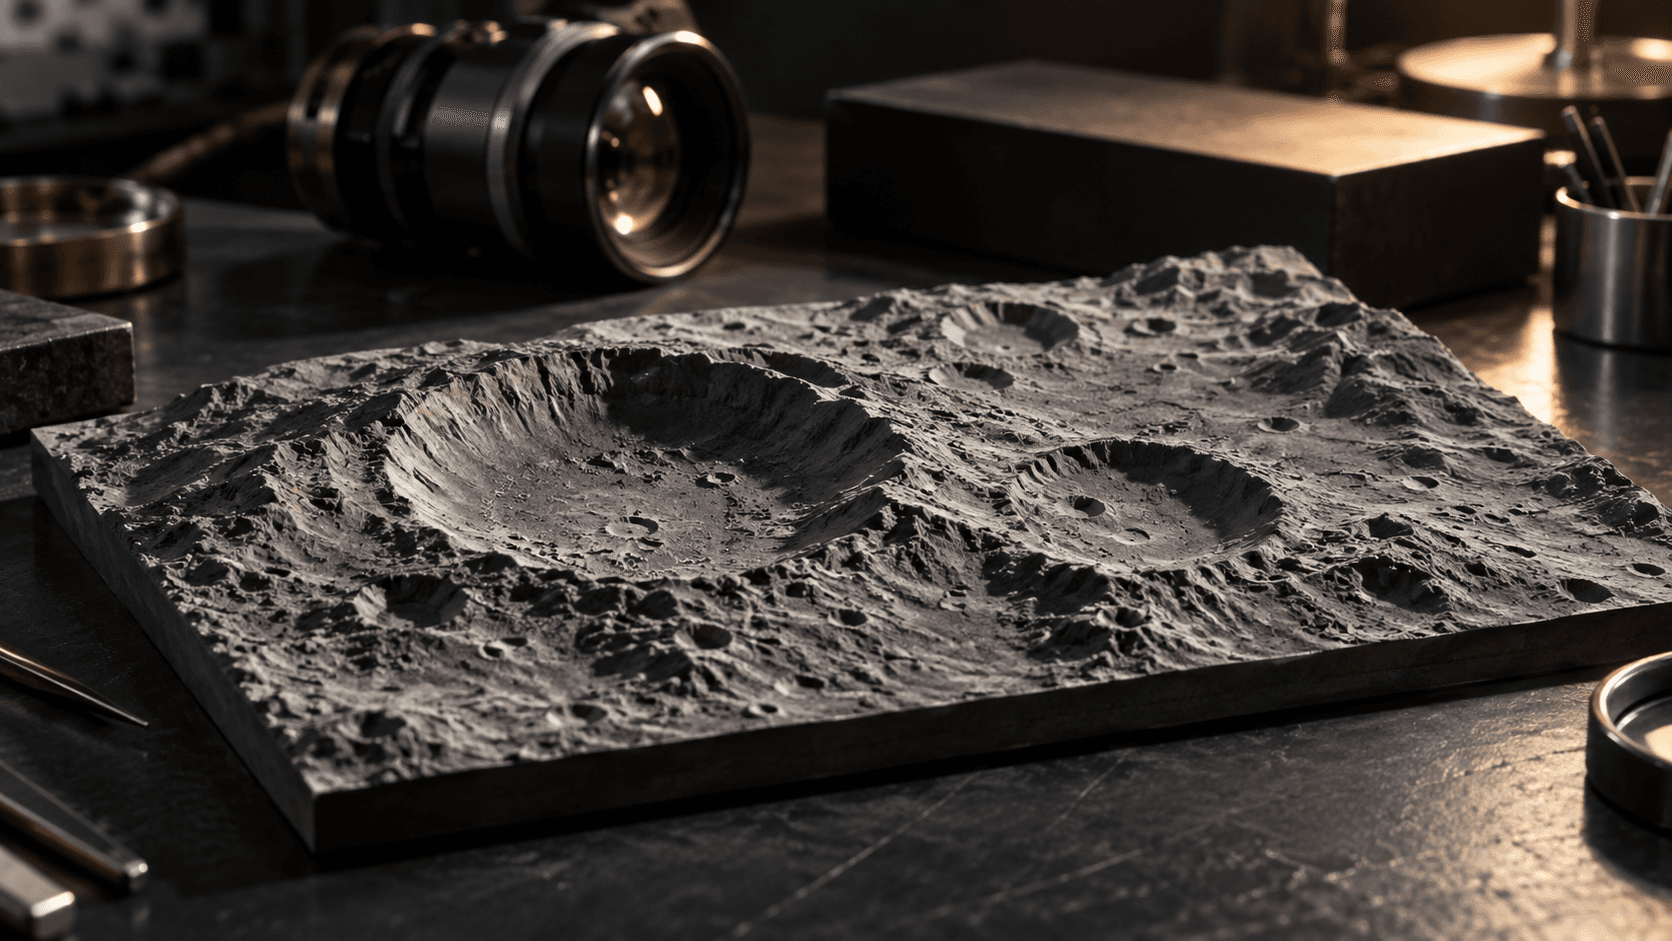
A lunar resource map can be useful without proving there is a resource to extract. That distinction sits at the center of NASA and IBM's new Lunar Foundation Model, and it is much more interesting than another claim that AI can see what humans missed. The release gives researchers a shared way to work through complicated observations. Its value depends on keeping the predictions attached to the evidence that produced them.
NASA and IBM announced the public release on September 10. NASA describes research applications including crater mapping, the identification of unusual volcanic features, and estimates of where polar ice could remain stable. The model, supporting data and downstream software are available for researchers to inspect and adapt. This is a released research tool, not an announcement that an autonomous system has selected a certified landing zone or located an economically recoverable ice deposit.
The practical opportunity is reuse. A scientist investigating craters and another studying polar conditions should not have to solve every underlying data-integration problem separately. A shared representation could let both start further along, then train for their own questions. That is an architectural argument, not a guarantee of better results on every task. The release is worth examining because it includes enough implementation detail to test that argument instead of simply admiring it.
NASA says the training material included roughly two million image tiles, combining meter-scale imagery with imagery at 100 meters per pixel. Observations from the Lunar Reconnaissance Orbiter form the core, supplemented by products from missions including GRAIL, Lunar Prospector and Japan's SELENE. IBM describes the broader aligned dataset as spanning more than 30 layers from nine instruments across four missions. Those numbers describe different aspects of the collection, not interchangeable measures of model capability.
IBM's research explanation illustrates the integration problem through the enormous difference between regional gravity measurements and detailed camera observations. It also emphasizes illumination: sharp shadows can conceal terrain, and a change in sunlight can alter the appearance of the same place. A dark patch is not a self-explanatory scientific label. Before asking a model to interpret an image, researchers need to preserve what the instrument measured and the conditions under which it measured it.
The technical report describes a system trained to predict concealed information from available observations. It uses a TerraMind-derived approach, trained from scratch on lunar material, with acquisition geometry supplied explicitly. In plain English, the model gets information about the observation rather than having to reconstruct all of that context from pixels. Shared weights handle the two resolution families. This does not turn coarse measurements into newly collected fine-resolution evidence.
The SomBench dataset documentation is where the less glamorous engineering becomes visible. Different measurements are aligned to the boundaries of image-based tiles. Files retain their coordinate system and pixel resolution. Missing observations remain marked as missing rather than quietly becoming ordinary values. The documentation also identifies resampling artifacts and uneven coverage as limitations. Alignment makes records usable together; it does not erase the differences between the instruments that produced them.
That matters for anyone building on the release. Treating an empty measurement as a zero would answer a different question from acknowledging that nobody measured that quantity there. Likewise, a sharper-looking output should not acquire the authority of an instrument simply because its edges look convincing. A responsible application should make those distinctions visible to the scientist reviewing it, even if doing so makes the interface less impressive in a demonstration.
SomBench also separates its pretraining material geographically. Whole zones are assigned to partitions, and tiles crossing zone boundaries are excluded. The purpose is to keep overlapping terrain from leaking across the separation between learning and evaluation. For a team testing a new downstream application, that is a useful starting discipline. It should still ask whether its own evaluation represents the locations and observing conditions it actually intends to study.
The crater results provide a concrete case for the approach. In Table 4 of the technical report, the lunar model reaches mean average precision of 0.2541 using half the training data, while the strongest listed ImageNet baseline reaches 0.2420 using the full training set. The authors report results across five random seeds. The point is not that a decimal score tells us how safe a landing would be. It is that domain-specific pretraining appears to reduce the labeling needed for this particular detection benchmark.
That conclusion needs the right scale attached. The WAC crater benchmark contains 1,000 tiles at 100 meters per pixel. Its labels come from the Robbins crater catalog, with crater centers and diameters translated into bounding boxes. The dataset card describes the catalog as nearly complete for craters roughly one to two kilometers across and larger, while warning that very small craters can be underrepresented. A successful test against that catalog cannot, by itself, certify detection of every smaller hazard.
NASA's broader scientific case for crater mapping is straightforward: crater counts and measurements help researchers interpret surface history. That is already a worthwhile application. There is no need to inflate it into a complete navigation system. Builders should resist collapsing scientific mapping, hazard assessment and operational clearance into one feature called lunar intelligence. Each would need its own evidence, evaluation target and accountable decision process.
The ice result requires even more care. IBM reports an approximately 22 percent reduction in root mean squared error against a SwinV2-B baseline. That is an error metric for the benchmark's target values. It is not a statement that the model found 22 percent more ice, nor that its predictions establish the amount of water available at a specific location. Turning one of those claims into the other would change the meaning of the experiment.
The ice dataset covers areas within about ten degrees of each pole at 240 meters per pixel. Its inputs include thermal conditions, terrain and the relationship to permanently shadowed regions. The target is a continuous prospectivity value built from weighted evidence. The dataset authors explicitly describe this as a tunable, model-derived product whose assumptions may change as direct constraints improve. Training a system to reproduce that target tests agreement with the prospectivity framework, not a fresh physical measurement.
The distinction does not make the experiment pointless. It changes how the result should be used. A sensible research workflow could use such estimates to organize candidate areas for closer investigation, then ask what additional observation would change the ranking. An extraction business would need a different evidentiary chain. Nothing in a prospectivity score, by itself, answers how much usable material is present, how accessible it is, or what recovering it would require.
Even the model's own documentation draws a hard boundary around operational use. It says the system has not been validated for landing-site certification or hazard clearance. Generated fields are not calibrated scientific products, and plausible local structure can coexist with incorrect absolute values. That is not an obscure disclaimer to bury below a visualization. It should determine which buttons an application is allowed to offer and what decisions remain outside its scope.
The benchmark story is also more selective than a universal victory lap. The technical report treats the leading meter-scale crater detectors and volcanic-feature segmentation models as comparable within run-to-run variation. A shared lunar model can be valuable while remaining merely competitive on some tasks. The correct purchasing or research question is whether reuse makes a particular workflow better, not whether every row of a comparison table can be marketed as a win.
Independent reporting from Live Science helps frame that boundary. Its September 10 coverage, based on a technical paper shared with the publication, reports the researchers' warning that pattern recognition cannot replace direct physical measurements. That is independent journalism about the release, not an independent replication of its benchmark results. LaunchPad Observer reviewed the released documentation and benchmark tables; we did not retrain the model or conduct a separate performance evaluation.
There is another important distinction in the software release. NASA's announcement describes a complete codebase, but the linked GitHub README identifies the repository as a fine-tuning and inference release and expressly says pretraining code is not included. Researchers get code for adapting and using the released model, including TerraTorch task configurations and evaluation commands. They do not get an end-to-end pretraining implementation simply by cloning that repository.
This is not a reason to dismiss the work. It is a reason to be precise about reproducibility. Repeating a downstream experiment from supplied weights and reconstructing the original training process are different undertakings. A team planning its own lunar research platform should decide which it needs before committing engineering time. The Apache 2.0 software license permits reuse under its terms, but a license does not supply an implementation that the repository excludes.
Data access deserves the same practical reading. The Hugging Face dataset page contains a small sample and catalog information; its documentation points to public AWS storage for the full dataset. A catalog row identifies a tile and its associated records. It is not the imagery itself. Before designing an application around the release, a builder should establish what must be downloaded, which measurements its task requires, and how those inputs will be preserved for later review.
My acceptance test would begin with a narrow scientific task and a credible existing baseline. Keep the evaluation data separate. Examine false detections, missed features and failures under different illumination. Record which inputs are actual measurements and which are derived products. Then measure whether the resulting workflow reduces expert review effort without concealing uncertainty. A faster first pass that creates a larger verification burden may be a worse system despite a better-looking demo.
For a Space Coast publication, the significance is not that another AI model has acquired a space-themed name. It is that infrastructure for interpreting the Moon is becoming available to teams beyond the original project. The strongest next step is to use that access to produce reproducible, task-specific evidence. Make a better scientific decision, document why it is better, and preserve the point at which the software has to hand the question back to an observation.
LaunchPad positionBuild around the released evidence and task-specific validation. Keep modeled prospectivity, measured conditions and operational decisions separate.
This report draws on the linked primary sources and reputable reporting. Company statements are treated as claims until independently demonstrated.